algraph:散布図
文書の過去の版を表示しています。
散布図
テンプレートファイル
- index.html
<!DOCTYPE html>
<object width="320" height="240" type="image/svg+xml" data="<%= Alone.make_uri(action:'graph_sample') %>"></object>
コード
- main.rb
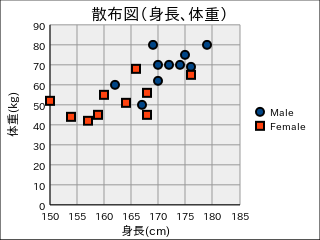
require 'al_template'
require 'al_graph_scatter'

class GraphSampleController < AlController
  def action_index()
    AlTemplate.run( 'index.rhtml' )
  end

  def action_graph_sample()
    data_m = [[172,70],[176,69],[170,70],[174,70],[170,62],
              [167,50],[175,75],[179,80],[162,60],[169,80]]
    data_f = [[157,42],[166,68],[160,55],[176,65],[164,51],
              [168,56],[159,45],[154,44],[168,45],[150,52]]

    graph = AlGraphScatter.new
    graph.add_data_pair( data_m, "Male" )
    graph.add_data_pair( data_f, "Female" )

    graph.add_main_title("散布図(身長、体重)")
    graph.add_xaxis_title("身長(cm)")
    graph.add_yaxis_title("体重(kg)")
    graph.x_axis.at_labels[:format] = "%d"
    graph.y_axis.at_labels[:format] = "%d"

    graph.draw
  end
end
requireが'al_graph'から'al_graph_scatter'に、クラスが AlGraphからAlGraphScatter等に変わる点にご注意ください。
データの与え方は、以下の3種類を用意しています。
データがペアになっている場合(上記例)
graph.add_data_pair( [[x1,y1], [x2,y2], ...] )
1次元配列で渡す場合
graph.add_data_pair( [x1,y1, x2,y2, ...] )
X軸データとY軸データを別々の配列で渡す場合
graph.add_data( [x1,x2,..], [y1, y2,...] )
algraph/散布図.1554634103.txt.gz · 最終更新: 2019/04/07 19:48 by hirohito