algraph:円グラフ
文書の過去の版を表示しています。
円グラフ
基本的な使い方
テンプレートファイル
- index.html
<!DOCTYPE html>
<img src="<%= Alone.make_uri(action:'graph_sample') %>">
コード
- main.rb
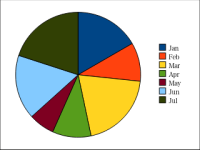
require 'alone'
require 'al_graph_pie'

class GraphSampleController < AlController
  def action_index()
    AlTemplate.run( 'index.rhtml' )
  end

  def action_graph_sample()
    ydata1 = [5, 3, 6, 3, 2, 5, 6]
    labels = ['Jan', 'Feb', 'Mar', 'Apr', 'May', 'Jun', 'Jul', 'Aug', 'Sep', 'Oct', 'Nov', 'Dec']

    graph = AlGraphPie.new
    graph.add_data(ydata1, labels)

    graph.draw
  end
end
折れ線グラフ、棒グラフと違い、requireが'al_graph'から'al_graph_pie'に、クラスが AlGraphからAlGraphPie等に変わる点にご注意ください。
サンプル
リリースファイルでサンプルとして提供しているものです。
デフォルト(再掲)

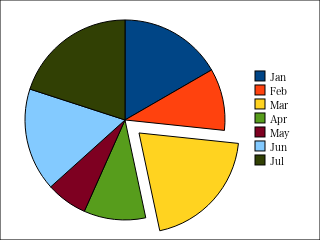
セパレートして強調
algraph/円グラフ.1554633391.txt.gz · 最終更新: 2019/04/07 19:36 by hirohito