algraph:棒グラフ
文書の過去の版を表示しています。
棒グラフ
基本的な使い方
テンプレートファイル
- index.html
<!DOCTYPE html>
<img src="<%= Alone.make_uri(action:'graph_sample') %>">
コード
- main.rb
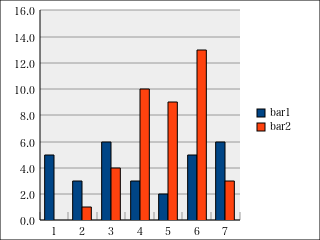
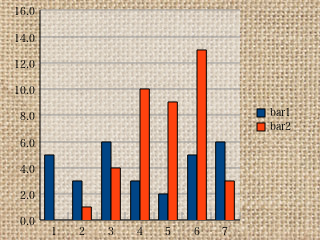
class GraphSampleController < AlController
  def action_index()
    AlTemplate.run("index.rhtml")
  end

  def action_graph_sample()
    ydata1 = [5, 3, 6, 3, 2, 5, 6]
    ydata2 = [0, 1, 4, 10, 9, 13, 3]

    graph = AlGraph.new
    graph.add_data_bar(ydata1, "bar1")
    graph.add_data_bar(ydata2, "bar2")

    graph.draw
  end
end

折れ線グラフとの違いは、add_data_lineメソッドの代わりにadd_data_barメソッドを使う点だけです。
まず、AlGraph.newで、グラフオブジェクトを準備します。
add_data_barメソッドを使い、棒グラフを2本追加しています。
最後に、draw メソッドで、svg を生成、出力します。
デフォルトでY軸は自動計算され、与えられた値に従って適切な値が選ばれます。
サンプル
リリースファイルでサンプルとして提供しているものです。
デフォルト(再掲)
棒間隔を指定(詰める)
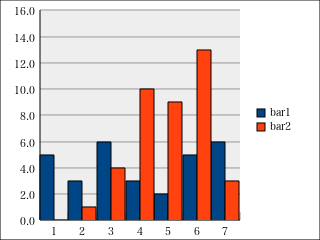
棒間隔を指定(開ける)

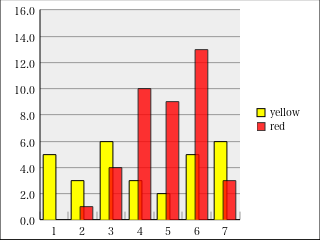
色、透明度アレンジ
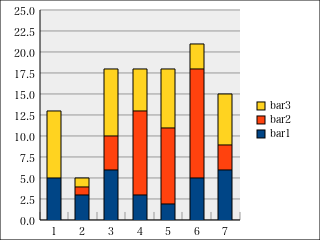
積み重ね棒グラフ
棒グラフ アレンジ例

棒グラフ アレンジ例2(バックグラウンドイメージ)
algraph/棒グラフ.1554630855.txt.gz · 最終更新: 2019/04/07 18:54 by hirohito